Since the amount of data has grown massively in last few years, the task of obtaining relevant information has become a challenge. Recommendation engines are one solution to such problem, where they aim to deliver accurate and relevant pieces of information to the users.
Recommendation engines are widely observed today, for example – youtube’s video suggestions lists, amazon’s recommended products and facebook’s friends and ads suggestions.
Types of Recommendation Engines
There are generally two types of recommendation engines – Collaborative Filtering Based and Content Based. Sometimes the hybrid models are also used.
Collaborative Filtering Models: are based on actions and behaviour of users. For example if a person having interest in thriller movies, is purchasing a set of thriller movies, another person having similar interests is also likely to buy same set of movies.
Content Based Models: are based on the features of the products, items with similar content are clustered together, and recommended together. For example – Apple Iphone and Apple Ipad belongs to one cluster of apple products, samsung phone and apple iphone belongs to one cluster of smartphones.
In each of the algorithms, the similarities between different items are calculated using any similarity measurement technique, such as – cosine similarity, vector similarity, levenshtein distance and edit distance etc. These similarity values are used to predict ratings for unobserved user-item pairs.
Recommendation Engine in Python
Let’s take a scenario for an ecommerce company, where a large number of users actively buy large number of products/items. To maximize their sales, The company wants to identify which of the brands are similar according to user behaviours and their buying patterns.
For this task, company has collected a data for users of random shoppers and the brands they purchased. The task is to create a model, that will recommend most similar brands with respect to a new brand.
The complete data can be downloaded from this link. It contains three columns – “User Id”,”Brand Id”, “Brand Name”.
Hypothesis Generation:
Before exploring the data, generating the hypothesis around the problem statement is really helpful. In our case, the problem statement is to create a collaborative filtering based brand recommendation engine. The hypothesis can be generated around the factors that will make two brands similar. For example
• Type of Products sold by them, example – cloths brands, sports brands, cars brands etc.
• Gender – for which gender the brands are famous for ? example – male brands, female brands.
• Parent Company – which is the main parent company for the brands. ?
• Do they belong to the category of expensive brands vs average brands ?
• People Interests – which people interests are important.
Exploratory Data Analysis:
Now that problem statement and hypothesis is generated, it is the time for data exploration which is one of the important component of any data science model. Some descriptive stats from the data can be obtained as –
• Total Records: 4,322,841
• Unique Users: 576,809
• Unique Brands: 11,288
Most purchased brands:
• Marc by Marc Jacobs 119644
• Christian Louboutin 115665
• Burberry 112238
• Gucci 102444
• Marc Jacobs 93478
• Jimmy Choo 88514
• Prada 86677
• Diane von Furstenberg 82491
• Yves Saint Laurent 82203
• Chlo 82130
Least purchased Brands
• Zita 1
• Personalized With Luv 1
• 9 Months up, 9 Months down 1
• Amy Zerner 1
• Petit Chapeau 1
• Atos Lombardini 1
• Caran d’Ache 1
• Yang Li 1
• Tiedeken 1
• Laura G 1
Since the data consists of about 11K brands, it is important step to normalize the data and get rid of weak data points, Hence all the brands below a certain threshold value are ignored from the data. For example – in this data, bottom 10% portion is discarded. Please feel free to suggest more data normalization techniques in the comments section.
Approach:
First of all, we need to transform the data into a User – Brand matrix, where each row represents a user, and each column represents a brand. Every cell indicates if the user has purchased that brand or not. The dimension of this matrix is U*B where U is the total number of unique users and B is the total number of unique brands. The resultant matrix is shown as –
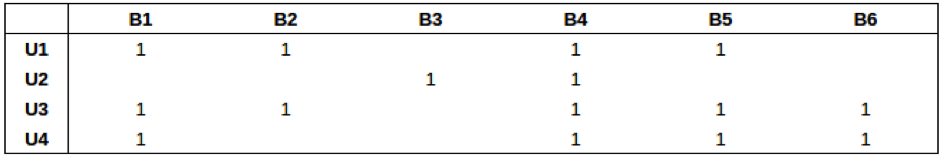
where, Mij = {1, if user i has purchased brand j, ” ” otherwise}
def prepare_dataset(self):
	user_brand = {}
	data = open(self.input_file).read().split("\n")

	for i,line in enumerate(data):
		row = line.split("\t")
		userId = row[0]
		brandId = row[1]
		brandName = row[2]

		if userId not in user_brand:
			user_brand[userId] = []
		user_brand[userId].append(brandId)

	return user_brand
Next, we need to create Brand – Brand similarity matrix. This User – Brand matrix is converted to Brand – Brand matrix, where both rows and columns represents the brands. Every cell contains represents the frequency count – number of times both brands appeared together OR When both brands were purchased by single user. The dimension of this matrix are B*B where B is the number of unique brands. Example –
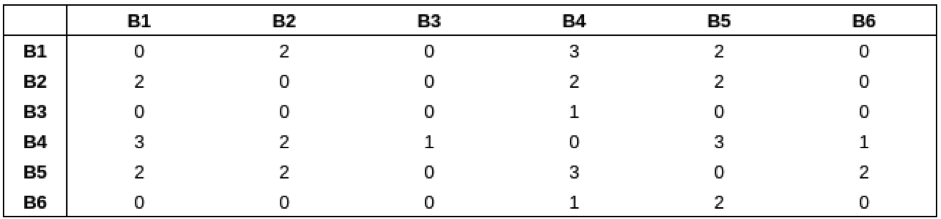
where, Bij = {n, if brand i brand j are co-purchased together n number of times, 0 otherwise}
def get_cartesian_pairs(self, lstA, lstB):
	pairs = [sorted(z) for z in list(itertools.product(lstA, lstB)) if z[0]!=z[1]]
	return list(pairs for pairs,_ in itertools.groupby(pairs))

def create_brand_similarity_matrix(self):
	similarity_matrix = {}
	for x,y in self.user_brand_matrix.iteritems():
		cartesian = self.get_cartesian_pairs(y, y)
		for pair in cartesian:
			if pair[0] not in similarity_matrix:
				similarity_matrix[pair[0]] = {}
			if pair[1] not in similarity_matrix[pair[0]]:
				similarity_matrix[pair[0]][pair[1]] = 0
			similarity_matrix[pair[0]][pair[1]] += 1
	return similarity_matrix
Next, we need to perform similarity measurements and identify the possible similar items for one item. For every row, the sorted values will indicate the possible similar brands.
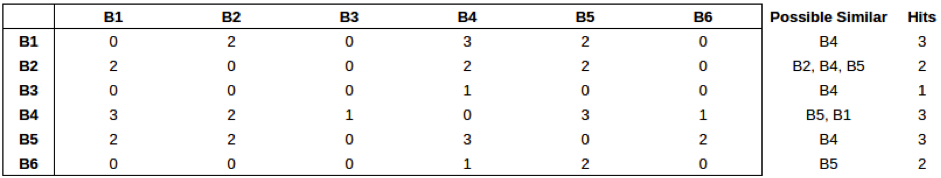
where, Possible Similar Brands = MAX[Brand j’s with respect to brand i]
def update_similarity_matrix():
	for bid, similar in self.similarity_matrix.iteritems():
		for simid, score in similar.iteritems():
			similarBrandName = self.brand_mapper.get(simid)
			brandName = self.brand_mapper.get(bid)
			doc = { '_id' : bid+" "+simid, 'brandId' : bid, 'similarId' : simid, 'score' : score, 'brandName' : brandName, 'similarBrandName': similarBrandName}
			push_data(document = doc, collection_name = "BrandSimilarity")

def get_most_similar(brandId, limit):
	pipeline = [{'$match' : {'brandId' : brandId}}, {'$sort' : {'score' : -1}}, {'$limit': limit}]
	result = db['BrandSimilarity'].aggregate(pipeline)
	return result
The function named get_most_similar performs aggregation over the brand – brand matrix, sorts the data and find the most relevant – similar brand. The full code can be downloaded here.
This tutorial explained the basics of collaborative filtering in python, obviously there exists more complicated and advanced techniques to cluster items based on user behaviour such as singular vector decomposition. Feel free to shoot out your queries in the comments section.